For most, the way to gather this information is to have a
subsurface company go out to the job site and perform potholes/testpits (whatever lingo you use).
What I hope to describe hereinafter is how to process that
information, once it is received from the subsurface exploration. Since it will be coming
from a outside source your simple N,E,Elev doesn't necessarily apply. Of course, you could strip the file down and
do some rearranging to conform to this format, but doing this you would lose pertinent field
comments attached to the output file. Notice in Image 1, how much more information is being supplied, in excess of the Northing, Easting and Elevation.
Image 2
With the stripped down file, now you can convert it to an
ascii file for import. Don’t worry if
it’s not in N,E,Elev format. I’ll show
you how to modify that, so it inserts all the information, when you import points.
Save the xls file as csv file.
Image 3
After you save it and open it again. It will look like this…….
Image 4
After you have it defined as a csv file, save it again Text Tab
Delimited Format (below).
Image 5
Open the txt file and it should look like this (it may need some
minor adjustments, by backspacing and tabbing to line columns up).
Image 6
(Notice above that no cells except ones in quotes have
spaces in them.)
First thing to do is set up your drawing. Use your Civil 3D Template to create a new
drawing. I xref’ed in the existing
utility file, since this is what information we are checking (verifying
horizontal location, as well documenting vertical). Theoretically, the potholes should shown over the lines of the found potholes shots.
Image 7
Click on “Points from File”
Image 8
Image 9
On the image above from the “Import Points” dialogue box, click the
icon next to “Autodesk Uploadable File”.
The “Point File Formats” dialogue opens.
Click “New”. Then click on “User
Point File” (highlighted).
Fill out the "Point File Format" Dialogue box. I just called it “Potholes1”. Set the delimeter in the top right to be
blank (meaning spaces/tabs). This differs
depending on how you created your txt file. The next step is to test how your text file will be imported. On the bottom left (Image 10),
click “Load”.
Image 10
Select your txt file.
Hopefully it should have loaded as shown below:
Image 11
Now comes the tricky part.
All the headings that read “<unused>”, you will have to label what they
are so the information on the bottom part of the screen knows what it will be used as. The problem is you won’t have the selection
you’ll need to label with the exception of Northing, Easting and Elevation and
possibly Description. So you’ll have to
leave this area and go to another to create U"ser Description Formats". There are several other Formats to chose from, such as Longitude and Latitude, but this is not information you are trying to get from spreadsheet to drawing.
Go into “Settings” from the Toolspace. Right-Click on “User-Defined Property
Classification” and select “New”. You’ll
notice below I created a group called “Potholes”. Once that group is created you can
Right-click on the group and add New.
Notice below I created 6 user-defined classifications. I gave them the format “String” since they
are basically comments and will not be used to do any calculations.
Image 12
This will be a bit tedious of a task, but will be well worth it if you are constantly receiving new pothole data. Now once those are created, you’ll have additional options
to select in the “<unsused>” headings in Image 11.
So returning to Image 11 and selecting the new User-Defined
Properties, the dialogue box should look like this……
(just click on "<unused>" and a pulldown menu will show that includes out-of-the-box description formats as well as the new String formats you created.)
Image 13
To test the points will be inserted correctly. Click Load on the bottom left, select the txt
file. The bottom half of the box should
populate. Hit “Parse” to see if the
information gets collimated correctly.
Image 14
The points are now ready to be imported. Run through the process of importing the points. It is a good idea to add these points to a Point Group based on the date received. It will be likely you will receive multiple sets and it's always good practice to break points into groups early on. You can always consolidate them later if you wish.
Below is a screen capture showing the points imported (in
approximate location to the utlity). It
shows with additional information that come in from User-defined
classification. You’ll have to go a
little further in modifying the Labels/Label Style to show the additional comments. I can explain this in another post if I get
any feedback. This may have been too much to uncover in one post.
Image 15
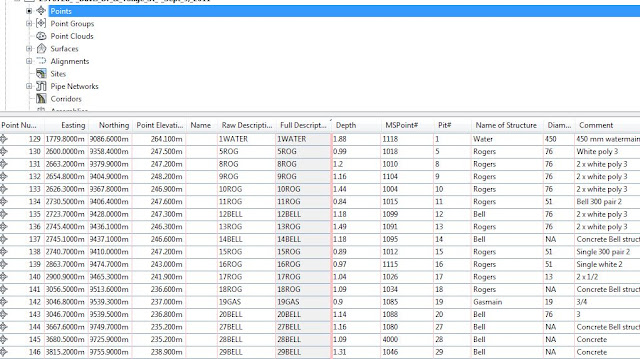
Realize that not all is lost just because the points are not showing labels. The data is still in the point list as shown in the image below.
Image 16
You’ve done most of
the grunt work already and it doesn’t require too much more if you can already
get this far. You can see the benefit of
adding the User-Defined information to the drawing, rather than using basic
Descriptions. Seeing the comments on the screen as your designing your utilities and laterals can be invaluable.
Of course, this works for other applications but this is one
that I personally have found useful. Hope I didn't bury you on this one!
Again, good luck!
George


No comments:
Post a Comment