Well...it's been over a year since I began posting Civil 3D exercises. I want to thank the people who have encouraged me to add more posts. It's not exactly motivational to post when people aren't offering feedback, so you can understand that your messages are truly appreciated.
I hope to continue to post into 2012 and possibly even more. Since this is a blog and not a formal "how-to" site, it can be quite random. Hopefully, a search engine brought you to a posting you found relevant. My intention for the new year, will be to add posts how to build Civil 3D data from the bottom up. The idea will be to introduce the new user, possibly providing a more linear format to the site. I, personally, have temporarily shifted to academia from industry. I will be teaching Civil 3D in a community college setting in the new year, and hope to structure the postings based on lecture material. Of course, I may still happen to have a "hand" in industry concurrently, and may make sporadic posts on current "real-world" projects.
I want to thank everyone for visiting in 2011, even for a brief visit. I wish you a patient and prosperous new year!
George
Brief Career Bio

- George Koumoutsidis
- Civil Engineer with a Masters Degree in Civil Engineering (Transportation). I also hold a B.Sc. in Civil Engineering and Geomatics. I am licensed as a Professional Engineer in both Canada and the United States.
Wednesday, December 28, 2011
Wednesday, November 23, 2011
Compiling Pothole Information – Ya Dig?
Since most of us aren’t designing in greenfields these days, the design we consider has to be investigated with respect to current conditions. In particular to the underground utlity,
water and sewer designer(s), they must obtain information of what exists under
the surface.
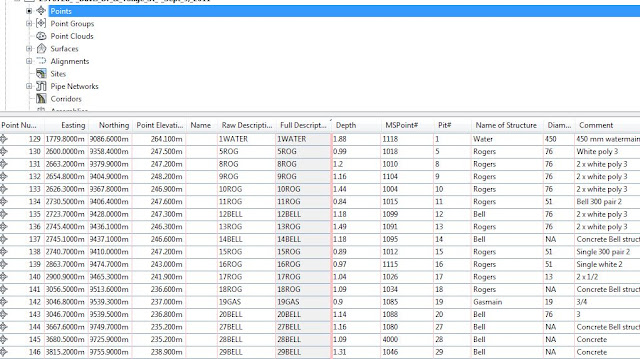
Below is an image of the spreadsheet file received from a subsurface
exploration company:

Image 1
Once you get a chance to look at the file, you have to decide
what you what to strip out to avoid confusion.
I have chosen to remove; “X, Y, Z” of “Adjacent Ground”, “Size and
Formation”, “Date Exposed” and “Picture”.
Once you determine what columns you
can do away with, delete them from the spreadsheet. Subsequently, you can delete the
rows that contain the text of the headings. In the
case above, delete rows 1 through 4 (but keep in mind what each column still
represents). I also took it one step
further and deleted any row that didn’t contain pot hole information eg. Row 2,
3 and 4.
If you notice in the slightly modified spreadsheet below, some cells that
contained no data, I replaced with “NA”. This serves as a place holder for converting
from an Excel to a Text Tab Delimited File.


The points are now ready to be imported. Run through the process of importing the points. It is a good idea to add these points to a Point Group based on the date received. It will be likely you will receive multiple sets and it's always good practice to break points into groups early on. You can always consolidate them later if you wish.

Hope I didn't bury you on this one!
Again, good luck!
George
For most, the way to gather this information is to have a
subsurface company go out to the job site and perform potholes/testpits (whatever lingo you use).
What I hope to describe hereinafter is how to process that
information, once it is received from the subsurface exploration. Since it will be coming
from a outside source your simple N,E,Elev doesn't necessarily apply. Of course, you could strip the file down and
do some rearranging to conform to this format, but doing this you would lose pertinent field
comments attached to the output file. Notice in Image 1, how much more information is being supplied, in excess of the Northing, Easting and Elevation.


Image 2
With the stripped down file, now you can convert it to an
ascii file for import. Don’t worry if
it’s not in N,E,Elev format. I’ll show
you how to modify that, so it inserts all the information, when you import points.
Save the xls file as csv file.

Image 3
After you save it and open it again. It will look like this…….
Image 4
After you have it defined as a csv file, save it again Text Tab
Delimited Format (below).
Image 5
Open the txt file and it should look like this (it may need some
minor adjustments, by backspacing and tabbing to line columns up).

Image 6
(Notice above that no cells except ones in quotes have
spaces in them.)
First thing to do is set up your drawing. Use your Civil 3D Template to create a new
drawing. I xref’ed in the existing
utility file, since this is what information we are checking (verifying
horizontal location, as well documenting vertical). Theoretically, the potholes should shown over the lines of the found potholes shots.

Image 7
Click on “Points from File”
Image 8

Image 9
On the image above from the “Import Points” dialogue box, click the
icon next to “Autodesk Uploadable File”.
The “Point File Formats” dialogue opens.
Click “New”. Then click on “User
Point File” (highlighted).
Fill out the "Point File Format" Dialogue box. I just called it “Potholes1”. Set the delimeter in the top right to be
blank (meaning spaces/tabs). This differs
depending on how you created your txt file. The next step is to test how your text file will be imported. On the bottom left (Image 10),
click “Load”.

Image 10
Select your txt file.
Hopefully it should have loaded as shown below:

Image 11
Now comes the tricky part.
All the headings that read “<unused>”, you will have to label what they
are so the information on the bottom part of the screen knows what it will be used as. The problem is you won’t have the selection
you’ll need to label with the exception of Northing, Easting and Elevation and
possibly Description. So you’ll have to
leave this area and go to another to create U"ser Description Formats". There are several other Formats to chose from, such as Longitude and Latitude, but this is not information you are trying to get from spreadsheet to drawing.
Go into “Settings” from the Toolspace. Right-Click on “User-Defined Property
Classification” and select “New”. You’ll
notice below I created a group called “Potholes”. Once that group is created you can
Right-click on the group and add New.
Notice below I created 6 user-defined classifications. I gave them the format “String” since they
are basically comments and will not be used to do any calculations.

Image 12
This will be a bit tedious of a task, but will be well worth it if you are constantly receiving new pothole data. Now once those are created, you’ll have additional options
to select in the “<unsused>” headings in Image 11.
So returning to Image 11 and selecting the new User-Defined
Properties, the dialogue box should look like this……
(just click on "<unused>" and a pulldown menu will show that includes out-of-the-box description formats as well as the new String formats you created.)
Image 13
To test the points will be inserted correctly. Click Load on the bottom left, select the txt
file. The bottom half of the box should
populate. Hit “Parse” to see if the
information gets collimated correctly.
Image 14
The points are now ready to be imported. Run through the process of importing the points. It is a good idea to add these points to a Point Group based on the date received. It will be likely you will receive multiple sets and it's always good practice to break points into groups early on. You can always consolidate them later if you wish.
Below is a screen capture showing the points imported (in
approximate location to the utlity). It
shows with additional information that come in from User-defined
classification. You’ll have to go a
little further in modifying the Labels/Label Style to show the additional comments. I can explain this in another post if I get
any feedback. This may have been too much to uncover in one post.

Image 15
Realize that not all is lost just because the points are not showing labels. The data is still in the point list as shown in the image below.

Image 16
You’ve done most of
the grunt work already and it doesn’t require too much more if you can already
get this far. You can see the benefit of
adding the User-Defined information to the drawing, rather than using basic
Descriptions. Seeing the comments on the screen as your designing your utilities and laterals can be invaluable.
Of course, this works for other applications but this is one
that I personally have found useful. Hope I didn't bury you on this one!
Again, good luck!
George
Monday, October 31, 2011
Labeling the Right-of-Way
There are several ways of showing this. Here's a quick and dirty.....
Road as shown below. Red lines are the ROW (cyan lines are daylight lines).

Create alignments for the ROWs. I used "Create Alignments from Objects" in this example. Also, be sure to have your centerline alignment defined.


Now right-click on the sample line (white line shown above). Click on "Sample Line Group Properties". The following dialogue box should present itself. Once there, click on "Profile Grade" (highlighted below)


Notice in the image above, there is no data in the Profile cells. Go back to the profile menu and "Create Surface Profile" for both ROW alignments.

Go back to the previous dialogue box (Image 7). You should now see options to select under "Profile", as well as "Marker Style". In this case, there was already a marker style set up for a ROW at 1:100 scale. Unfortunately, this isn't included out-of-the-box and you'll have to find something that work for you.


Road as shown below. Red lines are the ROW (cyan lines are daylight lines).

Image 1
Create alignments for the ROWs. I used "Create Alignments from Objects" in this example. Also, be sure to have your centerline alignment defined.

Image 2
Select "Sample Lines" from the Ribbon menu.

Image 3
Follow the command prompt by selecting your centerline alignment and then locate the station you want to set your sample line on. It doesn't matter where you put the sample line, because you can always slide it along the alignment later.
Once the sample line is in place, select "Section View", right under "Sample Lines" on the Ribbon.

Image 4
If you already have an existing surface either in your drawing or shortcut in, you should see something similar to what is shown below. Of course, it depends on you Section View Style.

Image 5

Image 6
Add the two ROW alignments you defined earlier.

Image 7
Notice in the image above, there is no data in the Profile cells. Go back to the profile menu and "Create Surface Profile" for both ROW alignments.

Image 8

Image 9
You'll be able to modify your Marker Style so it is represented on your client's requirements.

Image 10
If you decided to read through this entry, I hope it made your day just a bit easier.
-George
Wednesday, July 27, 2011
Pavement and Top of Curb Labeling via Civil 3D Expressions
When creating a grading plan, a typical production plan shows a "pavement" and "top of curb" location in the exact same spot. Obviously, if you show the label at the same spot the "pavement" (P) and "top of curb" (TC) will show the same elevation. The best way to avoid this is to label the pavement elevation and add an offset expression to modify the text output of the TC.
Take a look at the label below:

Image 1
Notice in the image above the P and TC are offset by 0.5', the depth of the curb height. To do this, I ensured I was consistent in labeling the pavement and not the curb (if you happened to add offset feature lines) from the surface model (I have presumed you already have your surface modeled).
Go to the "Settings" tab off of Toolspace. Expand Surface, then expand Label Styles. There, you'll see Spot Elevation. For reference, see the image below. Notice there are already several Spot Elevation label types created. The ones with the yellow triangles signify that they are still be utilized. The reason multiple label styles are created is obviously to accommodate the different type of curbs/gutters and combinations.

Image 2
I am going to explain the Label in use named "TC and P" shown on the Settings tab above.
Notice above the highlighted Expressions text. This is where you create a mathematical relation between the two elevations (notice the calculator icon :) )
Right click on Expressions and the following dialogue box will open:

Image 3
Fill out the dialogue box as required. For a 0.5' high curb I filled it out as shown below:

Image 4
Let me provide a brief explanation as to what is going on above. First click on the button next to the "function- F(x)" button. You shouldn't have as many options as shown above, but you should be able to select Surface Elevation. Add the term Surface Elevation to the expression, and it will be added with the brackets shown above. Subsequently, I added 0.5' to come up that distance from the pavement. Finally, I subtracted 4000'. This was done so the elevations were only read to the tens value, for example TC=40.57 rather than TC=4040.57. You can imagine how messy the labels would read if we actually had to show the actual elevation. A note on the plan is added to ensure that the 4000' additional feet is presumed. If it wasn't, I would suspect a new contractor would be in order. (NOTE!: In the image above I am editing an expression rather than creating one. When you're first creating one, you'll be prompted for a Name as shown in Image 3. I used "imperial tc")
OK. Now, we've created the Expression. Next step is to include it in the label.
Create a Style name for your new Spot Elevation style. For this style I used "TC and P".

Image 5
Once you have the style created. Go to the Layout tab.

Image 6
Surely, you may have to make some adjustments to aesthetic style, but I'm only going to go into detail of how to apply the Expression. Under "Component Name:" Select Surface Elevation. The Expression is applied on the Contents dialogue box under Text. Notice above it shown as a long string of text that includes "{\fArial....". This will be easier to understand when you open the dialogue box.

Image 7
The dialogue box is present above. Notice now you should have the expression you created available. As I mentioned earlier, I had named my expression "imperial tc". On the right side a preview shows underlined text of "TC=" with the expression appended to the text value (all underlined). In this step, you have to select the correct Expression with the correct output format and click on the "right-arrow" to register the value to the contents.
All the work you have done so far was to create only the TC value. Now you have to create the P value. Once you create the P value, you may find that you will have to alter some of the values/variables in Image 6.
To add the pavement elevation you have to create another component (see below).

Image 8
You can name the new component "Pavement" if you like. I accepted the default "Text.1" for the time being. Now, for the new component open the Contents dialogue box.

Image 9
You'll notice above that I am selecting an expression named "two digits". This was an expression I created earlier that would truncate the 4000 additional from the label, similar to what was done in Image 4 (with the exception of adding the 0.5'). Now you have your main "P" and "TC" labels created in the style. As I mentioned earlier, you'll have to adjust some anchor points, offsets and variables for the label to show correctly, but this should show you how to get started with applying Expression in Civil 3D.
Don't forget to worked on you Dragged State settings!!!! You love Civil 3D, don't you??!!!
Tuesday, July 26, 2011
AutoCad Civil 3D Certification
Hey Civil 3D Users!
I have recently become a Civil 3D Certified Associate via Autodesk. I am offering my services on a contract basis. If you are working for a firm that needs help implementing Civil 3D, I may be able to jump-start you in the right direction. For an idea of what kind of services I can provide, please have a look at my professional services page - http://komoeng.com/. The link to the page is also provided on the left side of the blog. Please understand the website at this point is a work-in-progress. :)
George
Wednesday, June 15, 2011
Show Me The Way....To The New Data Shortcuts
So you want to move your drawings around on a directory......You've already created an identical folder structure to what was originally employed in the initial project path. You've moved your working drawing models in the copied structure. You've already pathed the project data to the new project path.

Image 1
Image 1, above, shows the proposed new project path, changed from a "Z-drive" (network).
If you're lucky enough to have the software open a drawing for you, you may become unlucky because the project may not be pathing the correct data shortcuts (possibly using out of date objects).
If you have moved drawings and these drawings included data shortcuts, you'll need to use the DATA SHORTCUT EDITOR to fix the paths before opening any drawings. The DATA SHORTCUT EDITOR comes complete with the C3D package.

Image 2
Before you open the DATA SHORTCUT EDITOR, be sure to close all drawings that are being referenced to the subject project.
If you don't update the shortcuts the software begins searching for data shortcuts that are still pathed to the original network, a drive that may not exist anymore (my laptop doesn't have a "Z-drive"). Before I open the relocated drawings, and after I've copied the drawings to the desired path AND updated the project path as shown in Image 1, I open the DATA SHORTCUT EDITOR. In the DATA SHORTCUT EDITOR, I began to use the Find and Replace option to rename the paths. It may seem like a daunting task at first, but if you use the Replace All option you'll find it goes quicker than originally thought.

Image 3
Image 3 above shows the updated shortcut paths. You know you're good when your shortcuts here match the path shown above in Image 1.
Your drawings should open now.
Talk to you soon.
George
Thursday, June 2, 2011
Tooltip Where Are You?
Just a quick post.
Have you ever had the problem of the Tooltip not displaying. (The Tooltip is the list box that shows current values of an object you hover over -eg. below in Image 1 Elev=4.31.)

Image 1
If you have objects in your drawing and you have temporarily allowed your cursor to rest over it/them, you should see values similar to the ones shown above. However; sometimes other users turn these displays off because keeping them on uses more processing speed, ultimately slowing down your production (we can't have that ;) ).
To turn these back on:
Click the Settings tab on the Toolspace and Right-Click on the current drawing name.
The Drawing Settings dialogue box will open. Select the Ambient Settings Tab and select "Yes".

Image 2
You'll find if you're always working in the same files, it may be nice to have only some information shown by the Tooltip. For example, you may only want the Tooltip to show you elevations on a surface, but no offsets to an alignment. This is simple, you just work your way down the hierarchy and turn what you want on and what you don't need off. The sceenshot below shows how you would turn the surface (surface elevation) Tooltip on.

Image 3
Hope this quick tip save someone some hardship.
G.
Tuesday, May 10, 2011
Paving Plan Creation
One of the biggest obstacles to working with Civil 3D is deciding how to set up your files. You have to decide a plan of attack on what you will do in each model and/or drawing.
The great benefit of Civil 3D lies in the ability to have labels (information tags) update once you make changes to the model.
The following post will show an example of how I used a Civil 3D grading model to produce a dynamic paving plan. Just like everything in life...."there's more than one way to skin a cat", so take what you will from the post. It's an idea and if you can improve on it, even better.
Now how do you get from here:

Image 1
To here:

Image 2
That ultimately brings you to here:

Image 3
And a closer inspection:

Image 4
The first part of this process is having a surface developed. Take a look at the mess in Image 1 above. This is the working model. This model-drawing will have ongoing site grading changes occurring. This is where the actual data is being contained, for the purpose of displaying spot elevations as shown in Image 4. That being said, the drawing-model is not used directly for production drawings.
In addition to the actual drawing-model (you can call this FG.dwg for simplicity), I used:
-a site reference basefile (site.dwg)
Containing all curbs lines, edge of pavements, building footprints, etc.
-a site paving plan (paving.dwg)
Containing all construction/paving joints
-a spot shot plan (elevations.dwg), as shown in Image 2
Containing nothing but the paving spot elevation
Of course you'll probably have more, but this is all I'll introduce for showing the paving plan elements.
NOTE: Why is the site paving plan separated from the site reference basefile? Well, for this project there were so many concrete joints that modifying it it was best to have this drawing separately accessible from all the other drawings.
With the model already complete (which we know is never really complete, because there WILL always be changes), start an elevations.dwg file from your applicable template.
First thing to be sure of is that your project working file path is set up properly.

Image 5
Notice the "\model_files\c3d" (in my case pathed back the "C" drive")
Be sure to go into your model drawing (FG.dwg) and shortcut the surface out to the project directory "Data Shortcuts". Notice above, there are currently no shortcutted surfaces (ie. no "+"-sign next to the shortcut surface list).
In the model drawing (eg. FG.dwg) , right-click on "Data Shortcuts" on the Toolspace, then select "Create Data Shortcuts". When prompted, select the surface you would like to shortcut to the project directory (ie FG.dwg). (Not shown here.)
Notice below that the surface is now shown in the shortcut list. This will show in either the FG.dwg or the elevation.dwg.

Image 6
Switch back to the elevations.dwg and "Create Reference" of the FG surface.
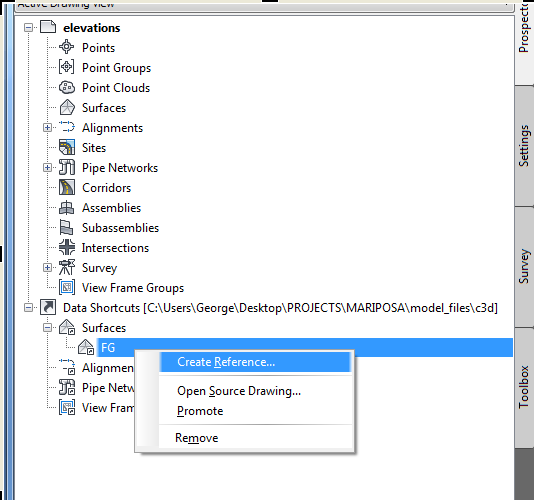
Image 7
IMPORTANT: Be sure to set your surface style to a non-display style, otherwise you will be battling TIN or contour lines (maybe both). The surface will be there, don't worry. I'll show you later.
XREF (preferably "overlay") the site.dwg and the paving.dwg into the elevations.dwg.

Image 8
The site.dwg and the paving.dwg are strictly 2D drawings.
With the 2D drawings now allowing you to see where the horizontal location of the surface is on the screen, you can zoom in and inspect elevations. If you have your tool tips display "on" and you hover your mouse over an area where the surface is, you'll see the proposed elevation at that location.

Image 9
Notice above, FG=4040.117'.
Hard part is over. Now you can begin to populate this drawing with spot elevations.
From the Ribbon as shown - below:

Image 10
Start picking/clicking the locations where the construction joints are on the plan. You will have to modify the location of the labels, if you change the location of the joints. Common sense of course, right?

Image 11
You'll notice the label above looks different than the labels shown in Image 4 earlier. This I will tackle in another post if I get any feedback, but this should be something that may give you an idea how to get started with a paving plan.
The beauty here is you can now modify the grading drawing (FG.dwg), and the labels will update themselves, eliminating tedious Cad changes!!! Yes!
Again, any feedback is greatly appreciated and I hope this help!
George
One last warning------if you change your construction joints, don't forget to change your grade breaks in your model drawing (FG.dwg).
Subscribe to:
Comments (Atom)